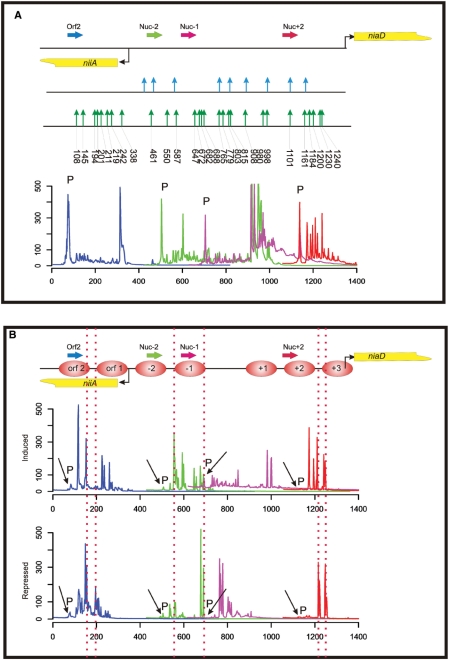
Figure 2.
MNase accessibility assay of the A. nidulans niiA-niaD locus employing the library-based chromatin analysis method. (A) Overview of the bidirectional promoter driving gene expression of niiA and niaD (the transcriptional start points of the genes are indicated by bent arrows). A summary of MNase hypersensitive sites obtained from in vitro digested control DNA of the region is presented (indicated by vertical arrows). The MNase sites determined by indirect end-labelling and hybridization (29) are shown in the upper part of this summary by blue vertical arrows and sites determined with the library approach in this work are shown in the lower part by green arrows. Numbers below the green arrows indicate the exact nucleotide position of the MNase cut in the niiA-niaD region. The fluorescently labelled gene-specific primers used for analytical PCR and subsequent fragment analysis are shown as horizontal arrows. The colour code of the primers represents the colour code of the fragment size profiles. Below the locus overview, we show the overlapping fragment size profiles of this region composed by processing the original sequencer chromatograms as described in Materials and methods section. Signals originating from the labelled primers still present in the fragment analysis reaction mixture after the analytical PCR reaction (not incorporated primers), are indicated by a ‘P’ directly above the corresponding peak. (B) Overlapping fragment size profiles in the niiA-niaD region obtained by PCR amplification of MNase digest libraries with labelled locus-specific primers. Nucleosomes are numbered consecutively from the central nfr between nucleosome −1 and +1 [according to Muro-Pastor et al. (29)]. Nucleosomes positioned within the reading frame of niiA are depicted as orf 1 and orf 2. Two libraries are compared: (i) ‘induced’ indicates the profiles obtained from the library constructed from chromatin digestion of cells treated with nitrate as inducing agent; and (ii) ‘repressed’ indicates the profiles obtained from the library constructed from chromatin digestion of cells treated with ammonium as repressing agent. ‘P’ indicates signals originating from the labelled primers. Vertical dotted lines are drawn to highlight the highly accessible regions at the borders of positioned nucleosomes.

