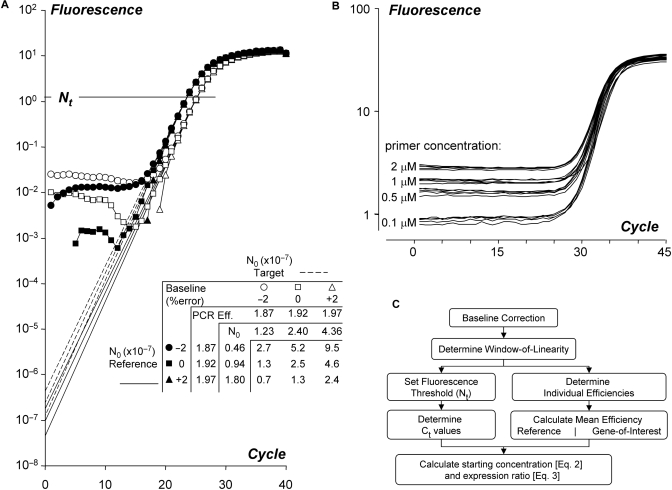
Figure 1.
Effect of baseline estimation errors in quantitative PCR data analysis. (A) The graph shows amplification curves of a reference (closed symbols, dashed lines) and a target gene (open symbols, solid lines) after subtraction of the correct and erroneous baselines. The different intercepts of the lines with the Y-axis illustrate the calculation of the starting concentration (N0) based on the observed PCR efficiency values (Box 1; Equation 2). The table shows that with an independent and random baseline estimation error of up to 2%, in both the reference gene and the target gene, the observed expression ratio varies from 0.7 to 9.5. Note that the extrapolation of the regression line(s) through the log-linear phase to cycle 0 is mathematically equivalent to the application of Equations 2, 3B or 3C (Box 1). (B) Raw fluorescence data of a PCR reaction with different primer concentrations. The curves show the amplification of NppB in chicken heart tissue. The fluorescence baseline increases with increasing primer concentration. (C) Flowchart of the analysis of quantitative PCR data described in this article.

