Figure 2.
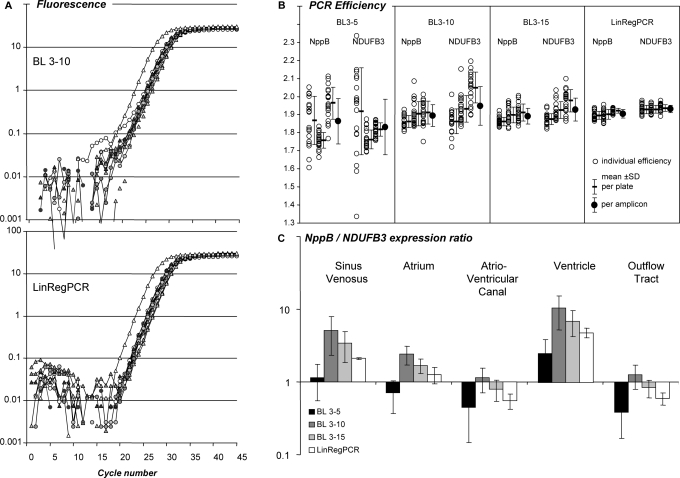
Effect of the baseline estimation method on qPCR data analysis. (A) PCR amplification curves of NppB and NDUFB3 in samples of five different parts of the developing chicken heart. Baseline fluorescence was estimated by the system software as a linear trend through the observations of cycles 3 through 10 (BL 3–10, top panel) or with the baseline estimation method described in this article (LinRegPCR, bottom panel). See Supplementary Figure S2A for additional system baseline settings.(B) PCR efficiency values of NppB and NDUFB3 from each individual sample (open circles) in three independent PCR runs. An optimal W-o-L was applied per amplicon per plate. Mean efficiencies per plate and per amplicon were calculated. PCR efficiencies were determined after application of three baseline trends, as well as after the LinRegPCR baseline subtraction. The variation was lowest in LinRegPCR-derived PCR efficiency values (see Supplementary Figure S2B). (C) NppB/NDUFB3 gene expression ratio in different parts of the developing chicken heart for each of the baseline correction methods. Note that the pattern of observed expression ratios depends on the applied baseline correction method. Variation in expression ratios per tissue is lowest in data derived from LinRegPCR-corrected data.

