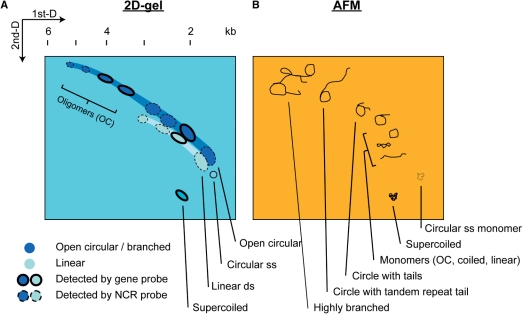
Figure 8.
Schematic diagrams showing the observed spots from 2D-gel and some DNA topology observed in AFM studies. By compiling the 2D-gel results that looked for psbA minicircles (Figure 4 and 5) and DNA structures revealed by AFM (Figure 7), the 2D-gel pattern (A) in corresponding to the minicircle structures (B) are illustrated. Major signal spots representing psbA minicircle DNA are drawn in the schematic 2D-gel (A), while possible corresponding DNA structures are outlined in the schematic AFM images (B). Extensive recombination activity may produce highly branch structures.

