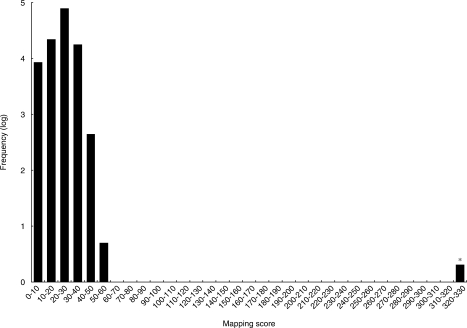
Figure 4.
Mapping score histogram of the xCyPA mRNA search results. Scores for all entries in the database are summarized in the histogram. Frequencies of entries within a 10-point scoring range were counted, converted to common logarithm of frequency +1 and plotted. Note that the histogram shows a ‘hit’ for the query, as indicated by a distinctly high score.

