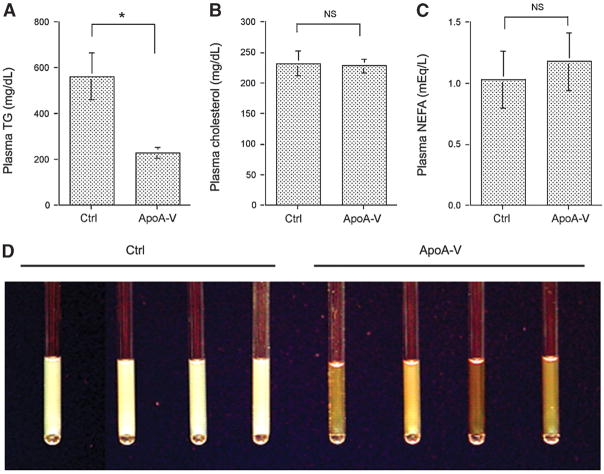
Fig. 1.
Lipid profiles. APOC3 transgenic mice treated with apolipoprotein A-V (apoA-V) and control (Ctrl) vectors were euthanized on day 14 after 16 h of fasting. Plasma levels of triglyceride (TG) (A), cholesterol (B), and NEFA (C) were determined. Aliquots of plasma (20 μl) of individual mice in capillaries were photographed (D). Data are expressed as means ± SEM. * P < 0.05.

