
Fig. 5.
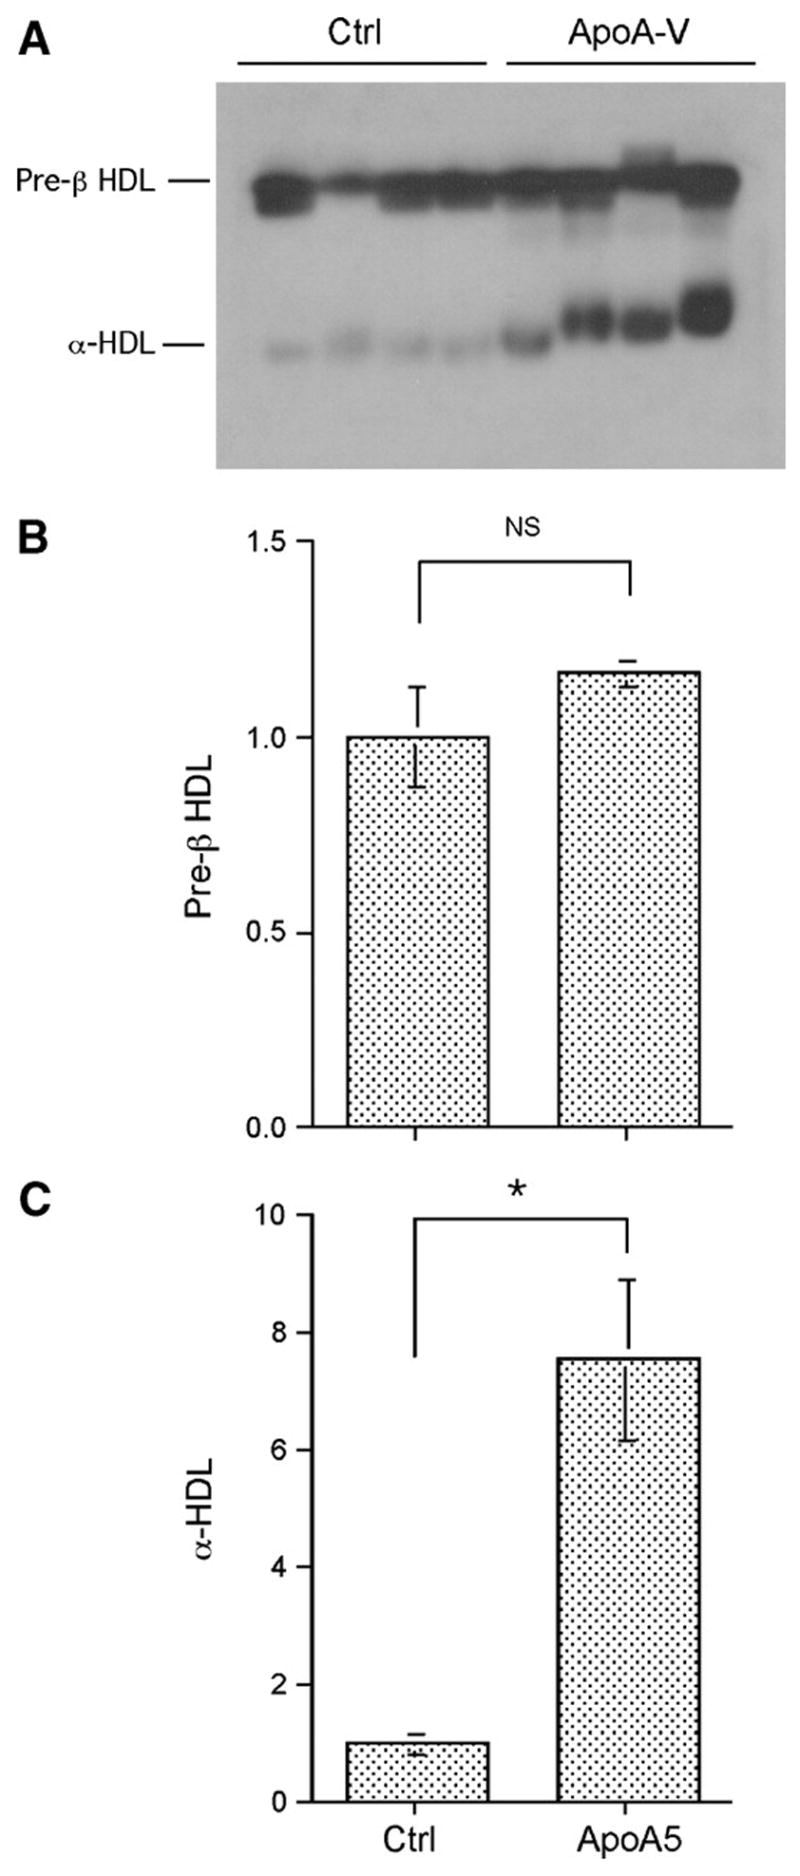
Effect of apoA-V on preβ-HDL and α-HDL metabolism. Aliquots of plasma (40 μg of protein) from euthanized mice were resolved on 0.7% agarose gels (A). Lipoproteins were transferred to nitrocellulose membrane by capillary blotting, followed by immune detection using rabbit anti-apoA-I antibody. Protein bands corresponding to preβ-HDL (B) and α-HDL (C) were quantified by densitometry. Data are expressed as means ± SEM. * P < 0.001. Ctrl, control.