
Figure 2.
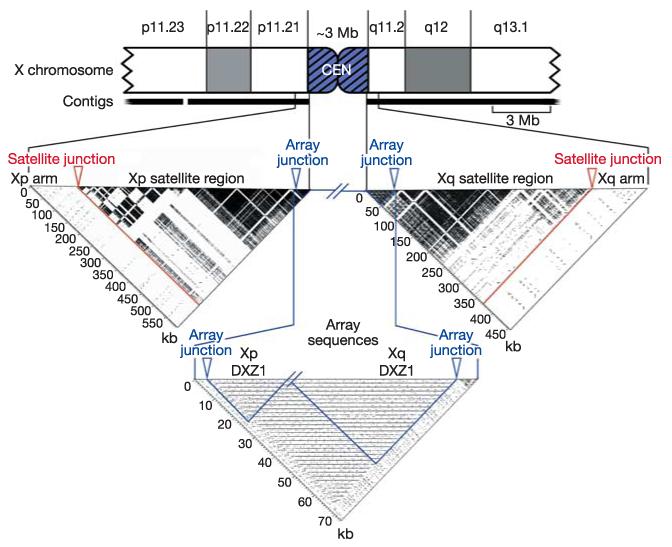
Xp and Xq pericentromeric contigs extend into the X-chromosome-specific higher-order alpha satellite, DXZ1. The pericentromeric region of the X chromosome is shown as a truncated ideogram. Self-self alignments of proximal sequences from each arm are illustrated by dotter plots below the ideogram. On each plot, the junction between the arm sequence and the arm-specific satellite region is marked by a red arrow, and the junction between the arm-specific satellite region and the X-chromosome-specific alpha satellite array (DXZ1) is marked with a blue arrow. Approximately 594 kb of sequence were analysed from Xp, including ~21 kb of DXZ1 sequence. The ~454 kb of sequence analysed from Xq included ~44 kb of DXZ1 sequence. In each case, ~100 kb of arm sequence were included. The highly repetitive structure of pericentromeric satellites is in stark contrast to the near absence of repetitive structure in the arm sequences, despite an unusually high density of LINE repeats in these regions. Gaps in the dark satellite regions occur where interspersed elements (LINEs, SINEs and LTRs) interrupt the satellite sequences. In the Array Sequences dotter plot, the most proximal ~21 kb of the Xp sequence is joined to the most proximal ~44 kb of the Xq sequence. The periodic nature of the centromeric, higher-order alpha satellite array is evident. Black horizontal lines on the plot reveal near identity of sequences spaced at ~2 kb intervals. This DXZ1 sample represents ~65 kb of the 3 (±0.4) Mb alpha satellite array. The regions outlined in blue are self-self alignments (‘Xp DXZ1’ and ‘Xq DXZ1’), and the remaining rectangular region of the plot is an alignment of Xp versus Xq DXZ1, which reveals the close relationship between DXZ1 sequences from each arm.