
Figure 6. Evolutionary synopsis of the Rho family.
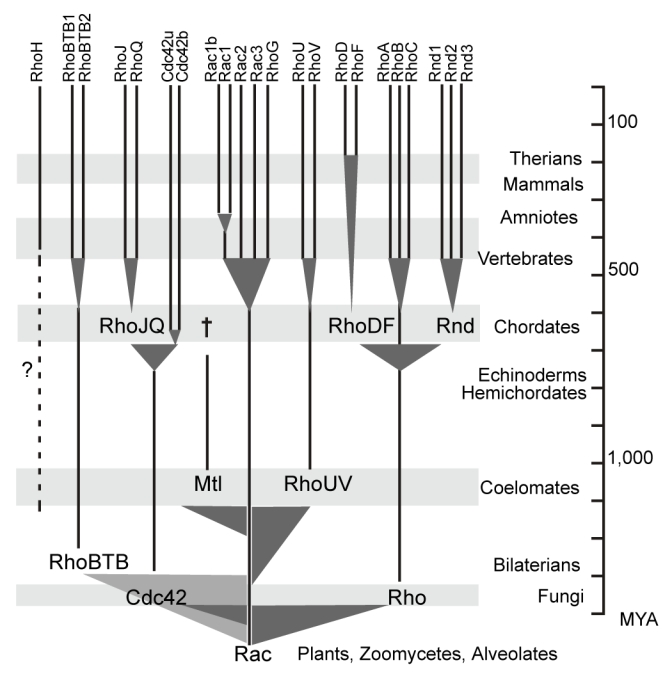
The phylogenetic tree of Figure 1 was redrawn taking into accounts the distribution of Rho subfamilies in the examined taxa. Shaded triangles indicate roots and intervals of emergence of the subfamilies. Scale time is in million years (MYA). Broken lines represent discrepancies between inferred phylogeny and observed emergence. † indicates subfamily extinction.