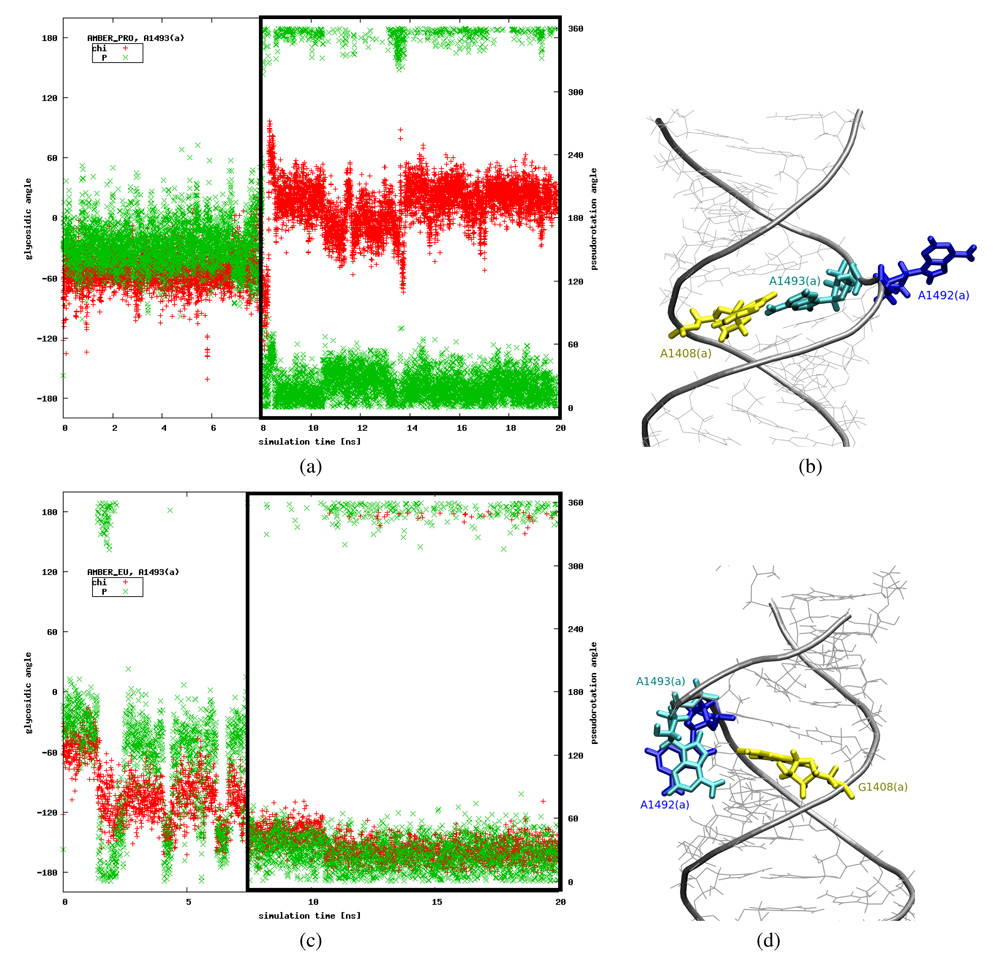
Figure 4.
Plots showing glycosidic (“chi”) and pseudorotation (“P”) angles changes in time [(a), (c)] in comparison with the configurations observed in MD trajectories [(b), (d)]. Black frames in plots (a) and (c) indicate the period in the simulation when the configurations presented in figures (b) and (d) were observed. Correct ranges of parameters for a base inside the helix are P ≈ 18° and χ ∈ {[–180; –90] ∪ [90; 180]}°.

