
Figure 3.
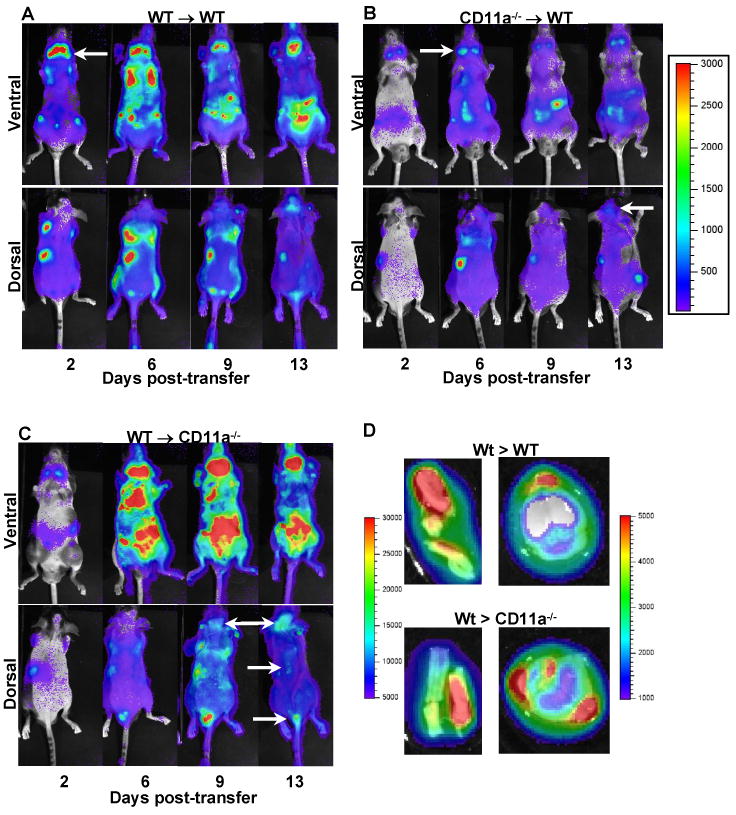
Bioluminescent imaging of wild type- or CD11a-/--T-lux T cells during the course of transferred EAE. Transferred EAE was induced as described in Materials and Methods, using MOG-sensitized T cells from wild type or CD11a-/- T-lux mice. The following combinations of transfers were performed: A, wild type to wild type (n=2), B, CD11a-/- to wild type (n=3) and C, wild type to CD11a-/- (n=4). Bioluminescent imaging was performed as described in Materials and Methods on days 2, 6, 9 and 13 post-transfer. Shown in each panel is representative ventral and dorsal imaging from one mouse at the indicated time points. Pseudo color scale for panels A-C is shown (100 min to 50,000 max) to emphasize spinal cord lesions or individual organ structures in which T cells have accumulated. Arrows indicate T cell accumulation in cervical nodes, brain or spinal cord. D, Ex vivo imaging of T-lux T cells in the brain and spinal cord of a mouse from a CD11a-/- mouse receiving wild type encephalitogenic T cells. At day 20 post-transfer, brain and spinal cord were removed, treated ex vivo with Luciferase assay system solution and imaged as described in Materials and Methods. Pseudo color scale for spinal cord images is shown (5,000 min to 30,000 max, left side of the images)) as well as for brain images (1,000 min to 5,000 max, to the right of the images).