
Figure 4.
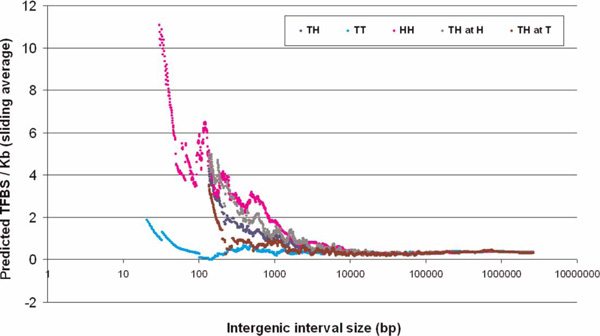
Predicted transcription factor binding site (TFBS) density for the three types of interval according to size. The sliding average technique used in Figure 3 is also used here. TH at H notes the density in the half of the TH interval that is closer to the gene beginning adjacent to the interval, while TH at T notes the density toward the gene that ends there.