
Figure 5.
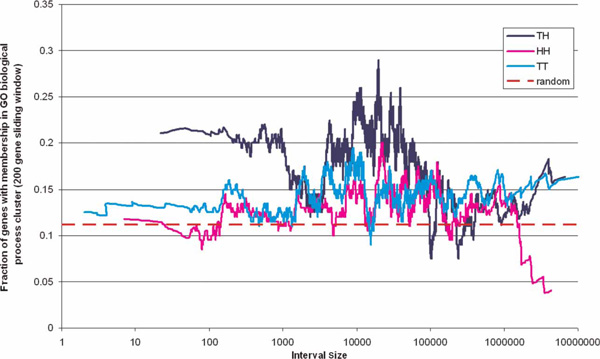
Gene Ontology clusters. The fraction of gene pairs with membership in common in biological proces clusters for the three types of gene pairs and according to distance. The sliding average approach used in Figure 3 is also applied here. The random expectation is shown with a dashed red line. Abbreviation: GO, gene ontology.