
Figure 6.
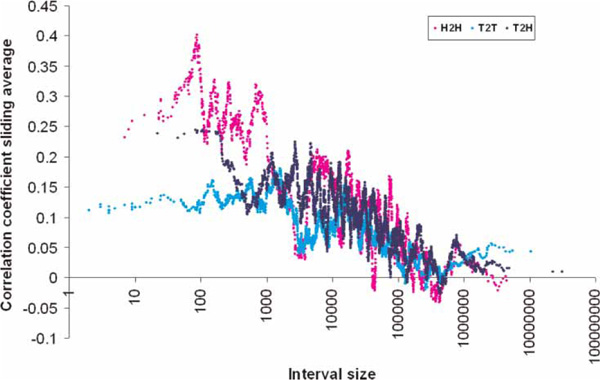
Spatial correlation of gene expression. Correlation of neighbouring gene expression across multiple tissue types and according to gene pair type and distance. The sliding average approach used in Figure 3 is also applied here.
Official websites use .gov
A
.gov website belongs to an official
government organization in the United States.
Secure .gov websites use HTTPS
A lock (
) or https:// means you've safely
connected to the .gov website. Share sensitive
information only on official, secure websites.
Spatial correlation of gene expression. Correlation of neighbouring gene expression across multiple tissue types and according to gene pair type and distance. The sliding average approach used in Figure 3 is also applied here.