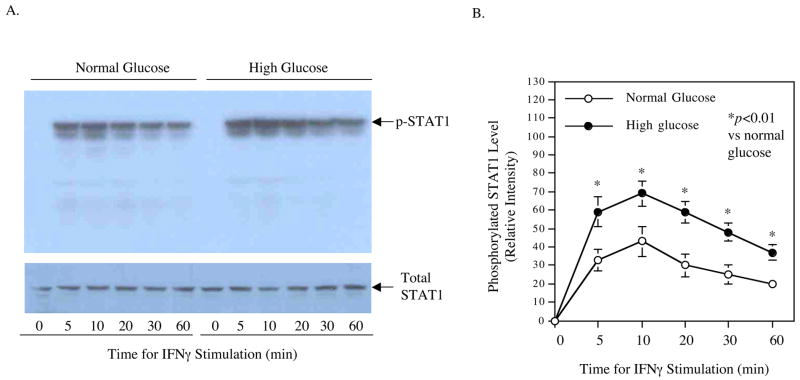
Figure 5.
Enhancement of IFNγ-induced STAT1 phosphorylation by high glucose. U937 macrophages cultured in normal or high glucose-containing medium were treated with 100 units/ml of IFNγ for different times as indicated. After the treatment, cells were lysed and aliquots of the lysate containing 50 μg protein for each sample were electrophoresed in a 10% polyacrylamide gel. The proteins were transferred to a nitrocellulose membrane that was subjected to immunoblotting using anti-phosphorylated STAT1 or anti-total STAT1 antibodies as described in Methods (A). The STAT1 bands on the film as shown in Fig. 5A were semi-quantified using densitometric scanning and the results were presented as relative intensity. The image presented in Fig. 5A is the representative of two independent experiments with the similar results. p-STAT1, phosphorylated STAT1.

