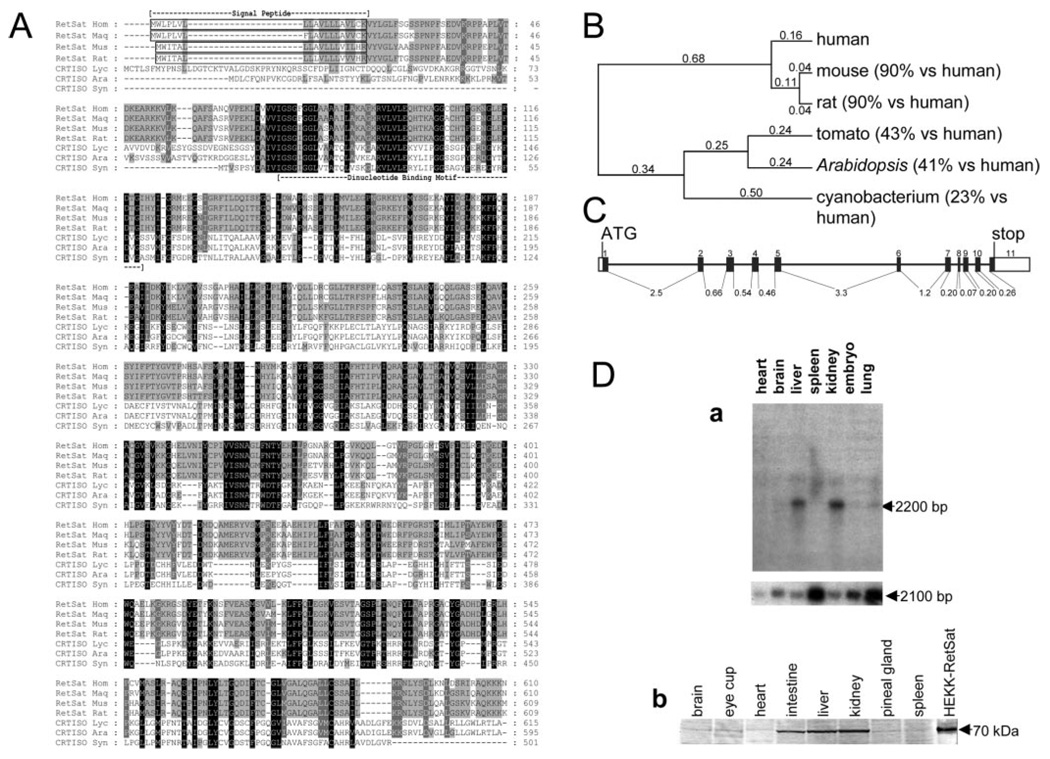
FIG. 1. Identification of vertebrate proteins with similarity to plant and cyanobacteria CRTISO.
A, sequence comparison of human RetSat (RetSat Hom-gi46329587), macaque-monkey RetSat (RetSat Maq-AY707524 submitted sequence), mouse RetSat (RetSat Mus-AY704159 submitted sequence), and rat RetSat (RetSat Rat-gi34855900) with tomato CRTISO (CRTISO Lyc-gi19550437), Arabidopsis CRTISO (CRTISO Ara-gi42561764), and cyanobacterial CRTISO (CRTISO Syn-gi16331999). White letters on a black background represent identical residues. White letters on a gray background represent conserved substitutions in all but one of the species examined, whereas black letters on a light gray background indicate substitutions conserved in four of the seven species examined. The dashed lines represent gaps introduced to maximize the alignment. The alignment was built using the program T-Coffee and the matrix BLOSUM62 (64) with gap penalties: existence-11, extension-1. Sequence-based predictions such as the signal peptide and a putative dinucleotide binding motif are indicated. A phylogenetic tree of CRTISO-like enzymes was built using the ClustalW neighbor-joining distance algorithm with numbers indicating evolutionary distances (65) (B). The percentage similarity to human RetSat is indicated in parentheses beside the gene name. C, gene structure of human RetSat as it is found on the minus strand of chromosome 2 from 85,556,195 to 85,543,754. The numbered black boxes indicate exons, white boxes indicate untranslated regions, and lines represent introns. The length of each intron is indicated in kbp. The start (ATG) and stop of translation are also indicated. D, tissue distribution of mouse RetSat. a, Northern blot analysis of mouse RetSat expression in various mouse tissues (top panel) indicates that mouse RetSat is expressed predominantly in the liver and kidney among the tissues examined. Control hybridization was performed by stripping and reprobing of the same blot using an antisense probe to nonmuscle β-actin (bottom panel). The size of detected transcripts is shown at the right side of the panels. Lysates of various mouse tissues containing 10 µg of protein per lane were subjected to immunoblotting using rabbit polyclonal anti-mouse RetSat serum (b). The lane labeled HEKK-RetSat shows the immunoreactivity of the mouse RetSat protein from the lysate of Tet-induced, HEKK-RetSat cells corresponding to 1 µg of total loaded protein. There is no immunoreactive band in the lysate of untransfected cells immunoblotted with either rabbit polyclonal or mouse monoclonal antibody (not shown). The apparent molecular mass of mouse RetSat is 70 kDa and is indicated to the right of the panel.

