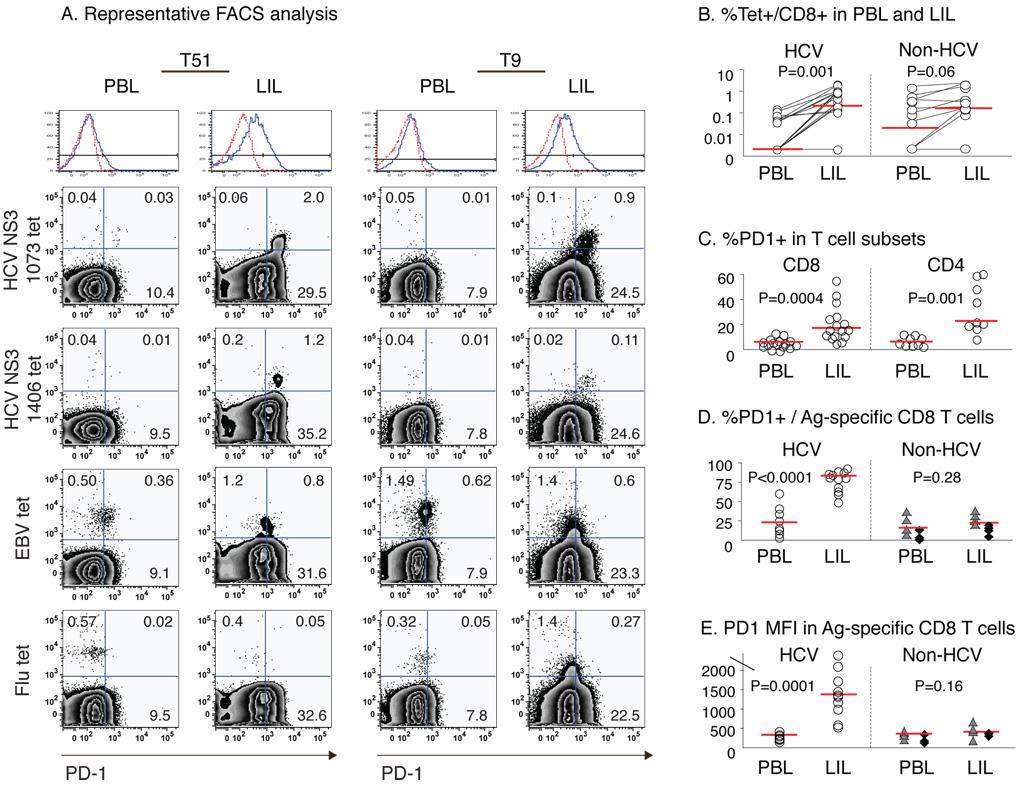
Figure 3. PD-1 expression is increased in HCV-specific CD8 T-cells in the liver compared to peripheral blood.
(A) Representative FACS plots for PBL and LIL from HLA-A2+ HCV-infected liver transplant recipients (T51 and T9) gating on CD8 T-cells. The top histogram shows the PD-1 cutoff strategy with isotype control (dotted red line). (B) Frequency of tetramer+CD8 T-cells specific for HCV (NS3 1073, NS3 1406, NS5B 2594), EBV and Flu epitopes in 8 HLA A2+ patients. Median values are indicated by red horizontal line. Median %HCV-specific CD8 T-cells: PBL 0.00% vs LIL 0.21%, p=0.001. Median %Flu or EBV-specific CD8 T-cells: PBL 0.02% vs. LIL 0.16%, p=0.06. (C) %PD-1 expression in CD8 and CD4 T-cells in 16 HCV-infected patients: Median %PD-1+/CD8 (PBL 6.1% vs. LIL 17.1%; p=0.0004); Median %PD-1+/CD4 (PBL 5.4% vs. LIL 21.9%; p=0.001). (D) %PD-1 expression and (E) PD-1 MFI on CD8 T-cells specific for HCV and non-HCV epitopes (EBV: triangle; Flu: diamond) from 8 HLA-A2+ HCV-infected patients. HCV-specific CD8 T cells: median %PD-1+ (PBL 23.0% vs. LIL 83.3%, p<0.0001); median PD-1 MFI (PBL 281 vs. LIL 1375, p=0.0001). Non-HCV-specific CD8 T-cells: median %PD-1+ (PBL 16.1% vs LIL 22.5%, p=0.28); median PD-1 MFI (PBL 356 vs LIL 406, p=0.16). P-values were determined by paired t-test or Mann-Whitney U.

