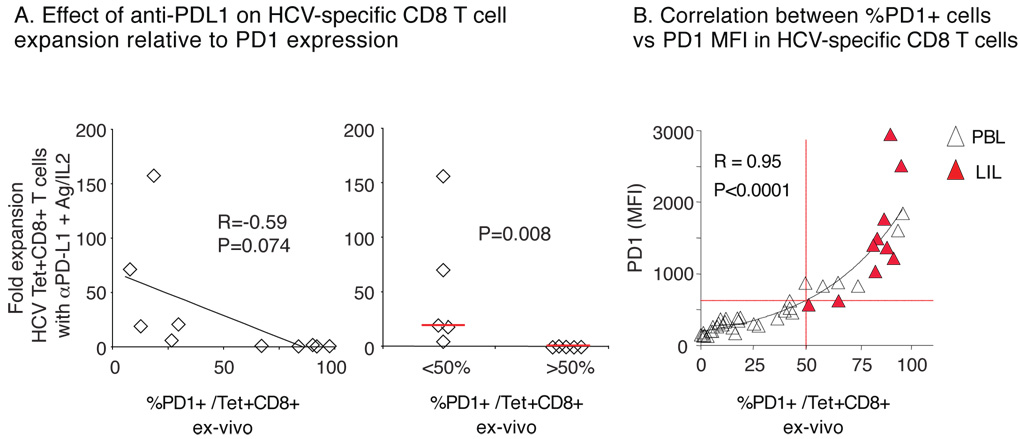
Figure 7. Inverse relationship between PD-1 expression and HCV-specific CD8 T-cell expansion with anti-PD-L1 blockade.
(A) Comparison of HCV tetramer+ CD8 T-cell expansion in vitro after 7 days of antigenic stimulation with anti-PD-L1 and ex vivo PD-1 expression directly (left) and in subgroups by %PD-1 cutoff of 50% (right). (B) Correlation between the frequency and MFI for PD-1 expression on HCV-specific CD8 T-cells with an exponential trendline (32 PBL, unfilled triangles; 10 LIL, red filled triangles).

