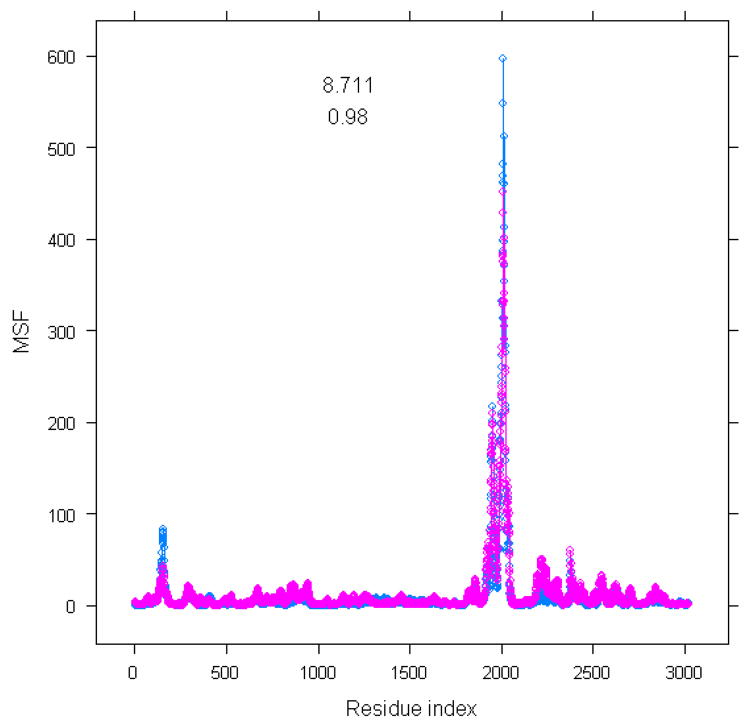
Figure 1.
Comparison in the mean-square fluctuations between 16S rRNA part in the complete structure and using single 16S rRNA molecule only. X-axis is residue index. Y-axis is mean-square fluctuations for 16S rRNA alone (labeled by pink color) and 16S rRNA subunit in the whole structure (labeled by blue color)

