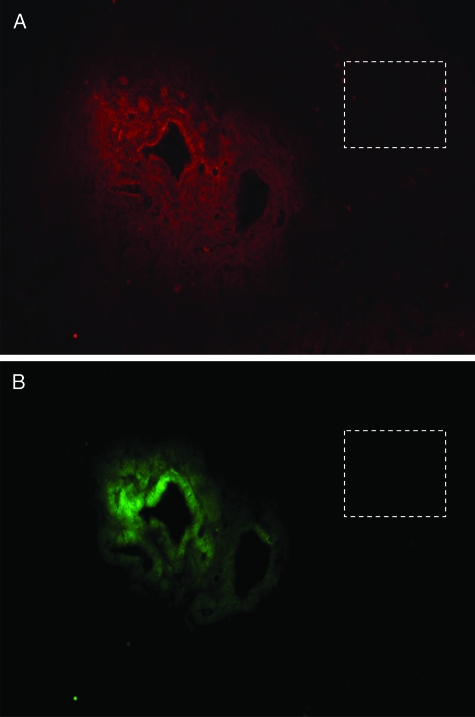
Figure 3.
Comparison, on the same section, of fluorescence signals from staining with an anti-GFP antibody and a TRITC-conjugated secondary antibody (TRITC filter A) vs. using direct GFP fluorescence (FITC filter, B). Magnification = original ×400. Note that signal intensity is weaker with the FITC filter compared with the TRITC filter due to the loss of signal associated with incubation with primary and secondary antibodies before fluorescence microscopy. The boxed area shows a region of recipient mouse liver that is GFP negative by both methods of detection. Mice were treated as in Figure 2. Similar results were seen in the other treatment groups shown in Table 1, which had engraftment rates ≥50%.

