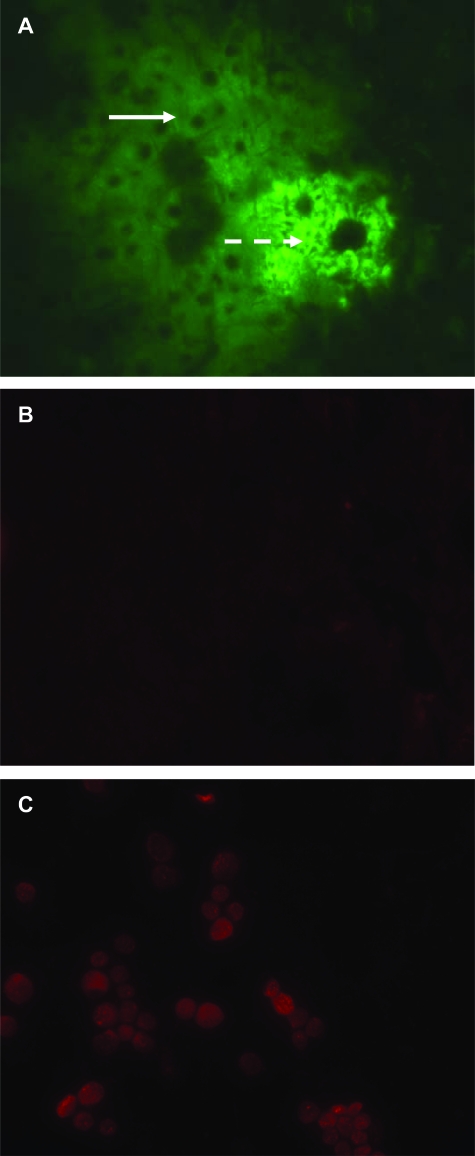
Figure 7.
PCNA expression in liver of a SCID mouse, treated as in Figure 2. A: A GFP+ colony as seen with FITC filter on fluorescence microscopy. Note the hepatocyte-like morphology of GFP+ cells to the left (solid arrow), which contrasts with the epithelial-like GFP+ cells to the right (dashed arrow). B: Same section as in (A) stained with a PCNA antibody. The faint, red fluorescence outside the nuclei is due to autofluorescence. C: PCNA immunofluorescence in an actively dividing subconfluent monolayer of wild-type GBEC. Magnification = original ×400.

