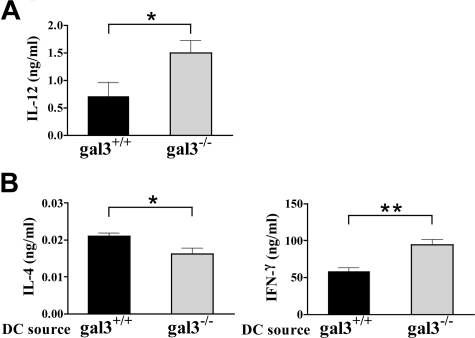
Figure 4.
Gal3−/− APCs exhibit a Th1-polarized response. A: Splenocytes from gal3+/+ and gal3−/− mice sensitized with OVA as described in Figure 2 were cultured in the presence of OVA (50 μg/ml) for 72 hours. The concentration of IL-12 in the supernatants was determined by ELISA (n = 6 gal3+/+, n = 5 gal3−/−). B: CD4+ T cells from OVA-TCR tg mice were co-cultured with bone marrow-derived DCs from gal3+/+ and gal3−/− mice in the presence of OVA323–339 peptide for 3 days. The same number of T cells (5 × 10⁵) from the two groups was further stimulated with anti-CD3 and anti-CD28 Ab for 48 hours. The concentrations of cytokines were measured by ELISA. Results are representative of three experiments. Bars represent mean ± SEM. *P < 0.05; **P < 0.01.

