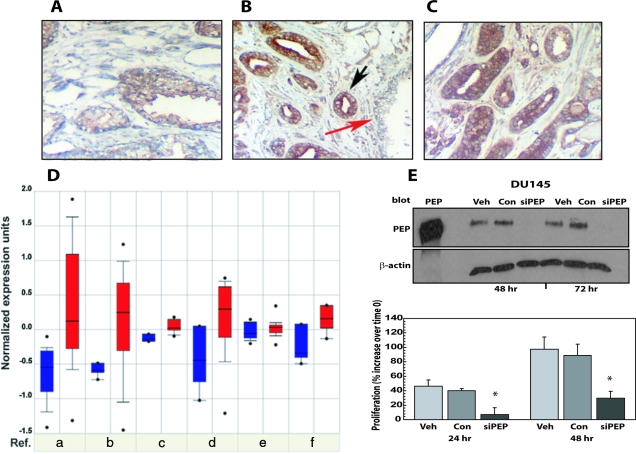
Figure 5.
Proepithelin is overexpressed in prostate cancer tissues and contributes in an autocrine manner to the transforming phenotype of DU145 cells. Formalin-fixed, paraffin-embedded sections of nonmalignant human prostate and prostate cancer tissue were deparaffinized in preparation for antigen retrieval by heating in a microwave oven for 10 minutes. Slides were cooled, rinsed, and immunostained using a goat anti-proepithelin antibody (Santa Cruz Biotechnology) and visualized with an avidin-biotin method. A and B, red arrow: Normal prostatic glands. B, black arrow, and C: Invasive prostate cancer. At least 10 independent fields were examined. Original magnifications, ×400. D: Expression array analysis of multiple prostate cancer microarray data sets was collected and analyzed, and statistical significance was calculated. Blue: proepithelin expression in normal tissues; red: proepithelin expression in prostate cancers. (a) Dhanasekaranet et al36 (normal/cancer = 12/25; t-test = −4.8; P = 2.9E-5); (b) Dhanasekaranet al35 (N/C = 22/59; t-test = −4.81; P = 4.3E-5); (c) Holzbeierlein et al37 (N/C = 4/23; t-test = −4.074; P = 0.01); (d) Welsh et al38 (N/C = 9/25; t-test = −3.03; P = 0.013); (e) Yu et al41 (N/C = 23/64; t-test = −2.279; P = 0.029); (f) Magee et al39 (N/C = 4/8; t-test = −3.005; P = 0.034). E: DU145 cells were transfected with a specific siRNA for human proepithelin (siPEP) and either DMSO (Veh) or control siRNA (Con) as described in Materials and Methods. Proepithelin expression in cell lysates (40 μg) was detected by immunoblot at 48 and 72 hours after transfection using anti-proepithelin polyclonal antibodies (Zymed Laboratories). One hundred ng of recombinant protein was loaded as control (PEP). Twenty-four hours after transfection, cells were washed and transferred in SFM and counted after 24 and 48 hours in a hemocytometer. The experiment is the average of three independent experiments run in duplicates ±SD. *P < 0.05 compared with control oligos-treated control cells (second and fifth columns).

