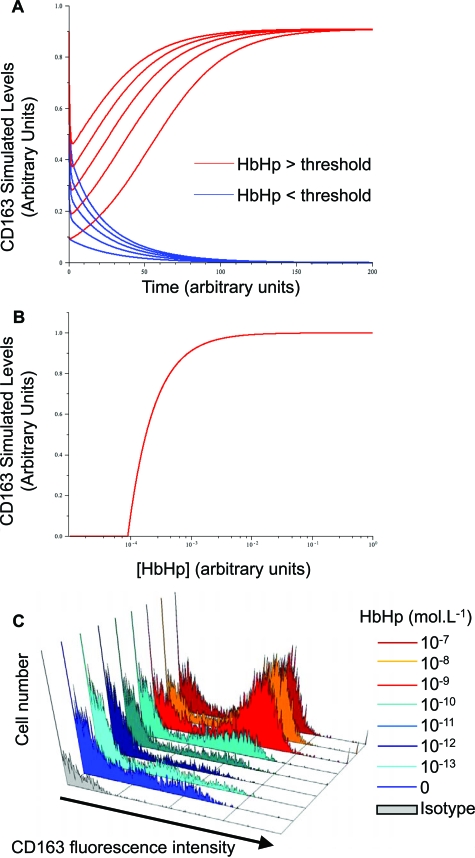
Figure 5.
Nonlinear dynamics demonstrate that Hb-gated CD163-IL10 feedback drives switching to HA-mac phenotype A: Representative simulated time course of CD163 levels in a simple mathematical model describing the positive feedback loop between CD163 and IL10 given by Equations 1 and 2, see Materials and Methods. Both axes are in arbitrary units. Blue curves show the behavior of CD163 for a low HbHp input ([HbHp] = 0.01 in arbitrary units) for a number of starting values ([CD163] = 0, 2, …, 8). Red curves show behavior for a high HbHp input ([HbHp] = 1) with the same starting levels. Other parameter values are = 10, k1 = 1, k2 = 1, kd1 = 1, kd2 = 1 (arbitrary units) and the initial level of IL10 is 0.5 (arbitrary units) in all cases. The qualitative behavior is independent of this choice, and similar threshold behavior can be observed for all choices of k1, k2, kd1 and kd2 as long as the sensitivity of CD-163 to IL10 is sufficiently high ([R] > k1 k2 kd1, SOM). B: Variation of final steady state values of CD163 and IL10 with HbHp input (all given in arbitrary units). Other parameter values are = 10, k1 = 1, k2 = 12, kd1 = 0.75, kd2 = 10−5 (arbitrary units). The steady states were obtained from Equations 3 and 4, SOM and clearly illustrate the threshold, which for these parameter values occurs at H* = 9 × 10⁻⁵. Similar qualitative behavior is seen for all other parameter values as long as > k1 k2 kd1. C: Observed concentration-effect curves for HbHp complexes on CD163 levels by flow cytometry. x axis, fluorescence intensity (CD163 staining (blue or red colors) or isotype control (gray). y axis, cell number. HbHp concentration in culture (expressed in mol/L) is given by the histogram color code as indicated. To match (A), red colors are above threshold and the blue colors below threshold. The experiment is representative of n = 5 donors.

