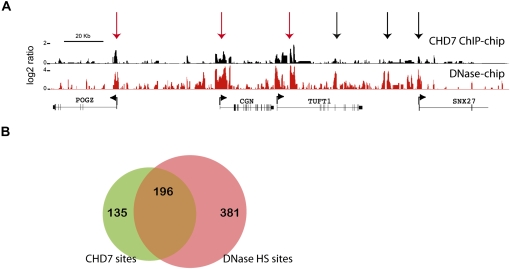
Figure 2.
CHD7 overlaps with a subset of regions known to harbor regulatory elements. (A) Regulatory elements were mapped using the approach of DNase-chip (red), and compared to CHD7 sites mapped by ChIP-chip (black). Median smoothed raw ratio data are displayed. Note that most of the CHD7 binding sites are contained within DNase I hypersensitive sites (red arrows), but not vice-versa (black arrows). (B) Venn diagram depicting the overlap between high confidence (P ≤ 1 × 10⁻¹²) CHD7 (green) and DNase-HS sites (pink) across the ENCODE regions.

