Figure 3.
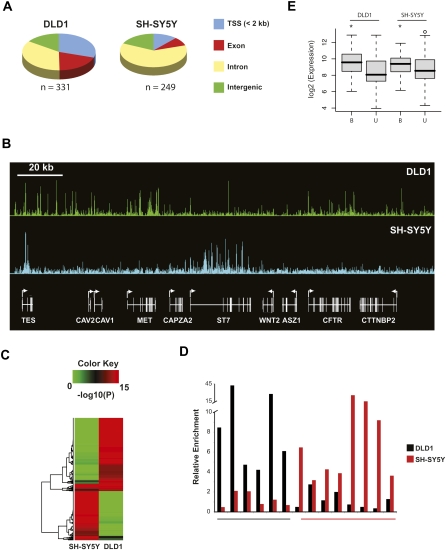
Characterization of CHD7 sites in DLD1 and SH-SY5Y cells. (A) Pie charts showing the distribution of CHD7 sites relative to GENCODE genes. (B) CHD7 ChIP-chip profiles from DLD1 and SH-SY5Y cells along ENCODE region ENm001. Raw ratio data are plotted. (C) Plotted in the heat map are P-values corresponding to signal intensities of all CHD7 sites identified by ChIP-chip in DLD1 and SH-SY5Y cells. (D) Confirmatory ChIP-PCR of CHD7 sites unique to DLD1 cells (underlined in black), and 8 CHD7 sites unique to SH-SY5Y cells (underlined in red). (E) Average expression of genes within 10 kb of a CHD7 site (B) and greater than 10 kb from a CHD7 site (U) in DLD1 and SH-SY5Y cells. The asterisk denotes significant differences as determined by Wilcoxon test (DLD1 P = 0.00005, SH-SY5Y P = 0.03).

