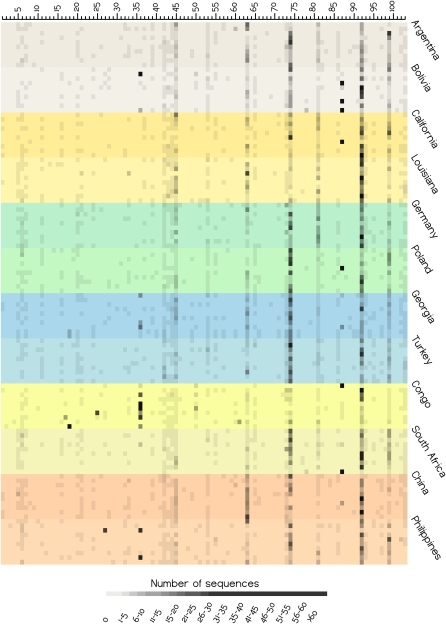
Figure 2.
Heat plot of the abundance of each bacterial genus in each individual, based on the partial 16S rRNA sequences. Each horizontal row corresponds to an individual saliva sample, with different colored shadings indicating the 10 individuals from each sampling location, and sampling locations from the same broad geographic region indicated by similar colors. Each column is a genus, with the numbers corresponding to the genus, as in Supplemental Table S13. The abundance of each genus (columns) is indicated by the grayscale value, according to the scale at the bottom of the plot.

