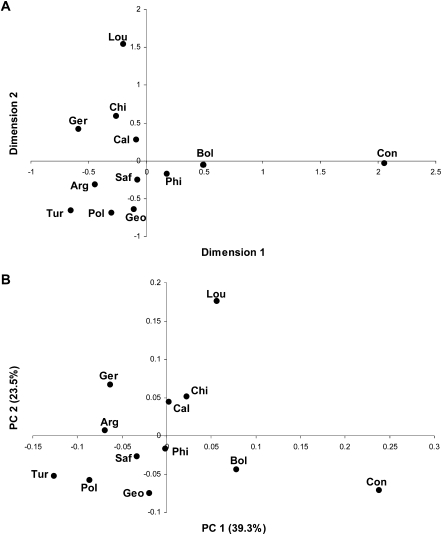
Figure 4.
Graphical depictions of the relationships among sampling locations based on the partial 16S rRNA sequences. (A) MDS plot, based on linearized FST distances (Slatkin 1995) between each pair of locations, calculated from the genus composition. The location abbreviations are as in Table 1. The stress value is 0.03. (B) PCA plot, based on the UniFrac distances (Lozupone and Knight 2005); same abbreviations as in A. The percentage of the total variance explained by each PC is indicated in parentheses.

