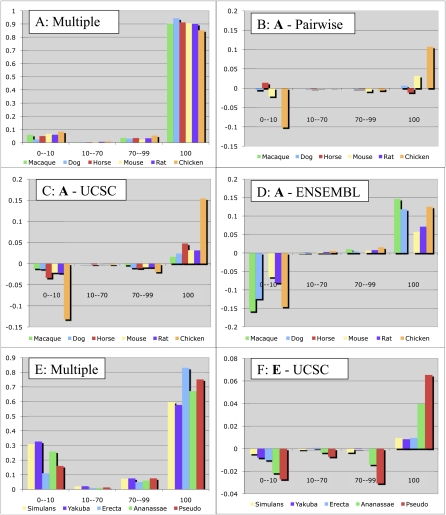
Figure 4.
Exon alignment accuracy for vertebrate (A–D) and Drosophila (E,F) genomes. Each category on the X-axis shows the exons for a particular species that are aligned to a reference genome exon over the given fraction of their length. The Y-axis for A and E shows the overall fraction of exons in each category for our alignments, while the other plots show the difference of these fractions between our multiple alignments and those from the UCSC Genome Browser (ours minus UCSC, C and F), those from the Ensembl browser (D), and our pairwise alignments (B). Our algorithms align more exons perfectly (100% category) and fewer exons are not aligned at all (0–10 category) for all species. In the comparison between our multiple and our pairwise alignments, while the macaque alignments are identical, and the dog alignments are nearly identical (the two species are close), the human/mouse alignment is slightly improved, and nearly 10% of chicken exons were aligned in the multiple but not pairwise alignment. The 23-way Ensembl alignments that we used had a different version of the horse genome, preventing a direct comparison, and we did not generate a pairwise human/rat alignment (rat would be very similar to mouse), hence the missing columns in B and D.

