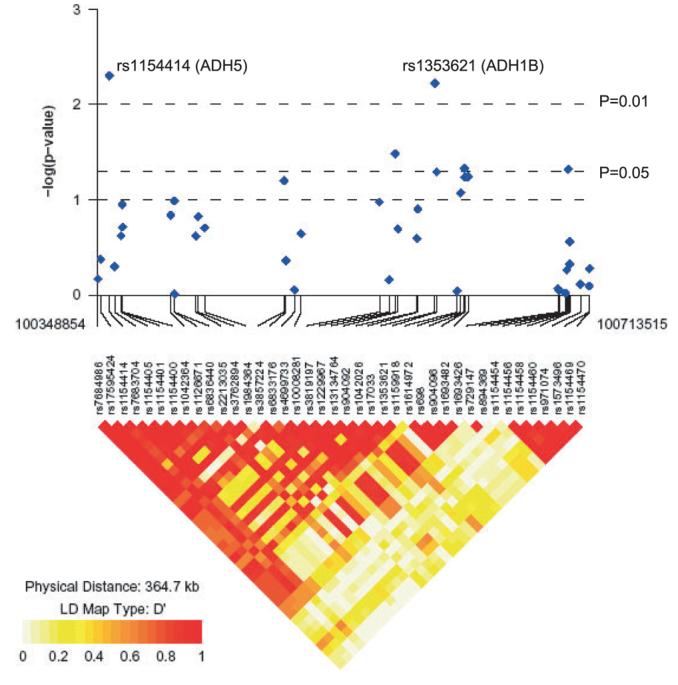
Fig. 1.

The linkage disequilibrium plot and nonadjusted p-values for markers in the ADH genes cluster. The single nucleotide polymorphisms are listed by chromosome position from pter toward qter.

The linkage disequilibrium plot and nonadjusted p-values for markers in the ADH genes cluster. The single nucleotide polymorphisms are listed by chromosome position from pter toward qter.