
FIGURE 3.
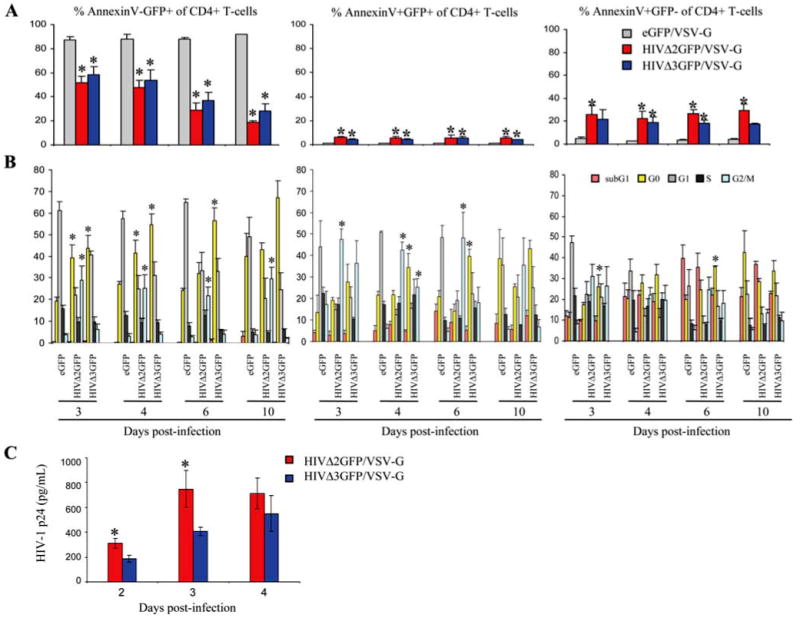
Cell cycle profiles of apoptotic human CD4+ T cells infected with VSV-G-pseudotyped HIVΔ2GFP and HIVΔ3GFP and sorted for GFP positivity. A, Percentage of annexin V−GFP+ (left panel), annexin V+GFP+ (middle panel), and annexin V+GFP− (right panel) cells. B, Flow cytometric analysis of cell cycle profiles in the cell populations reported in A determined by staining with an Ab against Ki-67 and 7AAD. C, Production of p24 in human CD4+ T cells infected with HIVΔ2GFP or HIVΔ3GFP. Production of HIV-1 p24 was measured in supernatants from infected, sorted cultures on days 2, 3, and 4 postinfection using a p24 ELISA. The results are expressed as the means ± SE of three independent donors. *, p < 0.05 related to decrease or increase.