
FIGURE 4.
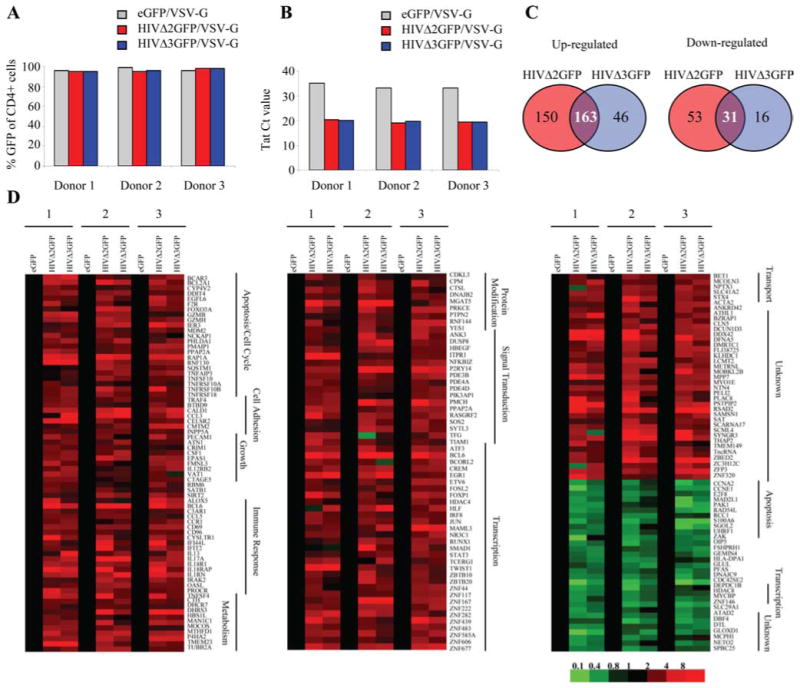
Vpr-independent gene modulation in HIV-1-infected cells. A, Percentage CD4+GFP+ T cells after infection with HIVΔ2GFP or HIVΔ3GFP and sorting using GFP as a marker. B, Detection of Tat expression by quantitative real-time RT-PCR in HIV-1-infected human CD4+ T cells. Cycle threshold (Ct) values are given. C, Venn diagrams illustrating the number of genes modulated in different culture conditions. D, Vpr-independent gene modulation in HIV-1-infected CD4+ T cells. Profiles of up-regulated (red) or down-regulated (green) genes in human CD4+ T cells infected with HIVΔ2GFP or HIVΔ3GFP. The color scale is shown below the panels.