
FIGURE 5.
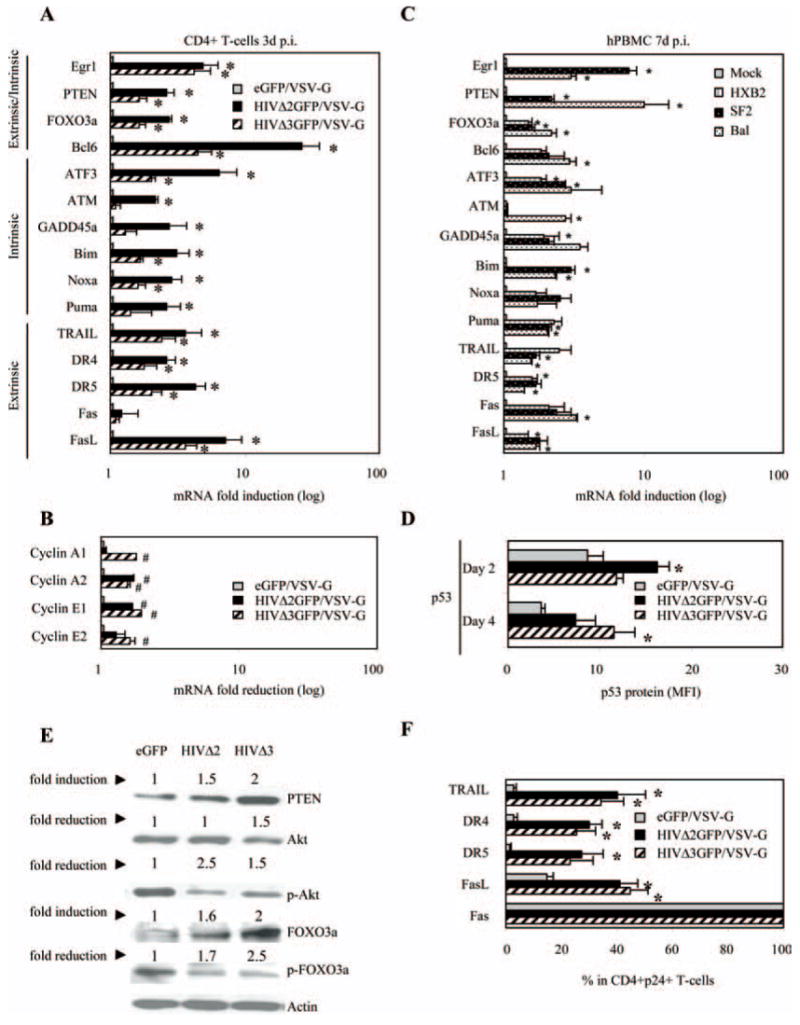
Expression analysis of selected genes modulated by HIV-1 in CD4+ T cells and in total PBMC. mRNA up-regulation of apoptosis-related genes (A) and mRNA down-regulation of selected genes involved in cell cycle regulation (B) were monitored by real-time PCR using RNAs from VSV-G-pseudotyped HIVΔ2GFP or HIVΔ3GFP infected, sorted human CD4+ T lymphocytes. Results are normalized to GAPDH and are expressed as fold induction (A) or fold reduction (B) relative to eGFP control. C, Same as A, but in this case the analysis is conducted in human PBMC infected with wild-type HIV-1 viruses with different tropism. The data represent the means ±SE of three independent experiments. *, p < 0.05 related to induction in expression and #, p < 0.05 related to reduction in expression. D, p53 protein expression was monitored on days 2 and 4 postinfection by intracellular staining. The data are obtained and quantitated with flow cytometric analysis and expressed as MFI. E, Protein accumulation levels for PTEN, Akt, phosphorylated Akt (Ser473), FOXO3a, and phosphorylated FOXO3a (Ser318) were measured on day 3 postinfection by Western blot and quantitated using Kodak image scan. Results are normalized to β-actin and are expressed as fold induction or fold reduction relative to eGFP control. F, TRAIL and TRAIL death receptors (DR4 and DR5), as well as Fas and FasL protein expression, were measured 24 h after sorting by surface or intracellular staining and analyzed by flow cytometry. Mean percentage ± SE of cells expressing each particular protein is reported for CD4+GFP+ T cells. The data represent the means ± SE of three independent experiments. *, p < 0.05 related to induction in expression and #, p < 0.05 related to reduction in expression.