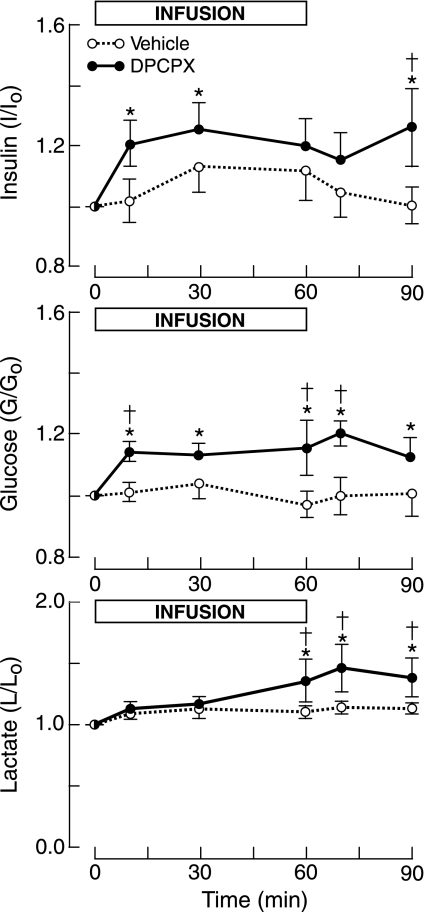
Fig. 1.
Fetal plasma concentration ratios (concentration/concentrationtime 0) of insulin, glucose, lactate relative to levels at time 0 for infusion of the A1-receptor antagonist DPCPX or vehicle. Horizontal bar shows time of infusion. Vertical bars show means ± SE. *P < 0.05 compared with time 0. †P < 0.05 compared with vehicle.

