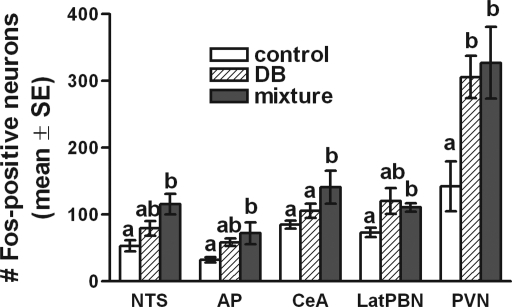
Fig. 2.
Effects of intragastric DB and T2R agonist mixture on the number of Fos-positive neurons counted within the caudal visceral NTS (collapsed across rostrocaudal levels), AP, central nucleus of amygdala (CeA), lateral (Lat) parabrachial nucleus (PBN), and paraventricular nucleus of hypothalamus (PVN). For each region, bars represent the average number of Fos-positive neurons per tissue section within each treatment group (means + SE; n = 5/group). Within each region, bars with different letters are significantly different from each other (P < 0.05); bars that share a letter are not different.

