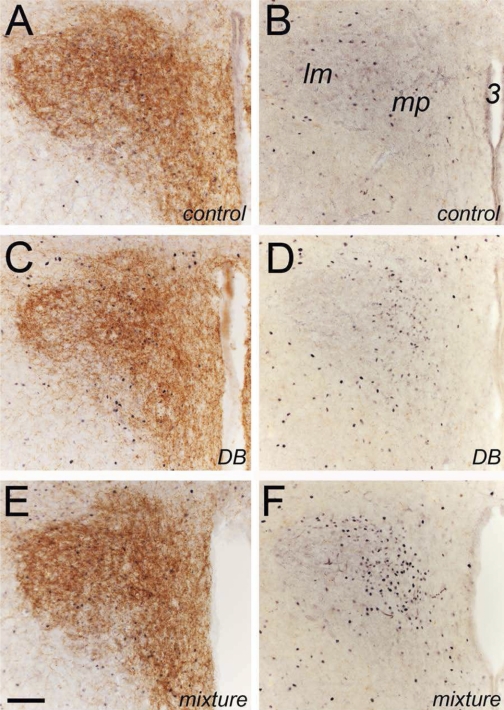
Fig. 5.
Representative color photomicrographs depicting immunolabeling for Fos (black nuclear label) in sections through the hypothalamic PVN that were double labeled for either DβH (brown axonal and terminal label; A, C, E) or CGRP (B, D, F; note that PVN contains little or no CGRP labeling) after intragastric gavage of water (control), DB alone, or a mixture of T2R ligands. Neural Fos labeling appeared to be increased after intragastric gavage of either DB alone or the T2R ligand mixture. Quantitative data are provided in Fig. 2. Scale bar = 100 μm, A–F. lm, lateral magnocellular; mp, medial parvocellular; 3, third ventricle.

