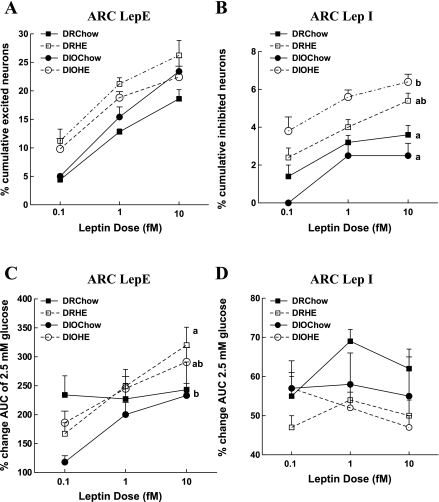
Fig. 3.
Effects of genotype and maternal diet on leptin-induced changes in [Ca2+]i oscillations. Hypothalamic arcuate nucleus (ARC) neurons of DR and DIO offspring as described in Fig. 2. Total numbers of neurons analyzed for a given group are as follows: DR chow = 448, DR HE = 474, DIO chow = 465, DIO HE = 539. A: cumulative percentage of LepE neurons at the three increasing leptin doses. B: cumulative percentage of LepI neurons at the three increasing leptin doses. C: percent increase in AUC on the addition of leptin compared with 2.5 mM glucose. D: percent decrease in AUC on the addition of leptin compared with 2.5 mM glucose Data are expressed as means ± SE. Parameters with differing superscripts differ from each other by P < 0.05 by post hoc Bonferroni tests after intergroup differences were found by ANOVA.

