
Figure 1.
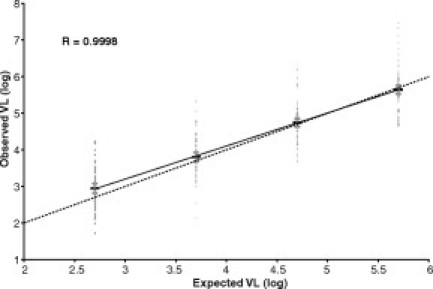
The mean viral load value for each panel member is shown (thick horizontal line) and is flanked by error bars (shorter horizontal lines) reflecting 95% confidence intervals. Raw viral load values (n = 343) are also shown. The best-fit linear regression line (r = 0.9998; slope = 0.90) is shown as a solid line connecting the four data groups. The dotted diagonal line reflects equivalence of X- and Y-values.