
Figure 1.
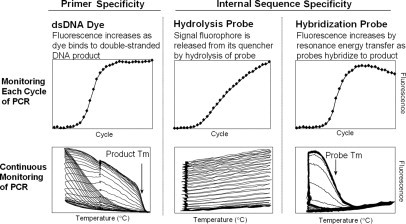
Monitoring PCR in real time using DNA dyes, hydrolysis probes, and hybridization probes. The top row shows data collected once each PCR cycle, and the bottom row shows data collected continuously (five times per second) during all PCR cycles. Adapted from Wittwer and Kusukawa4 with permission of the publisher.