
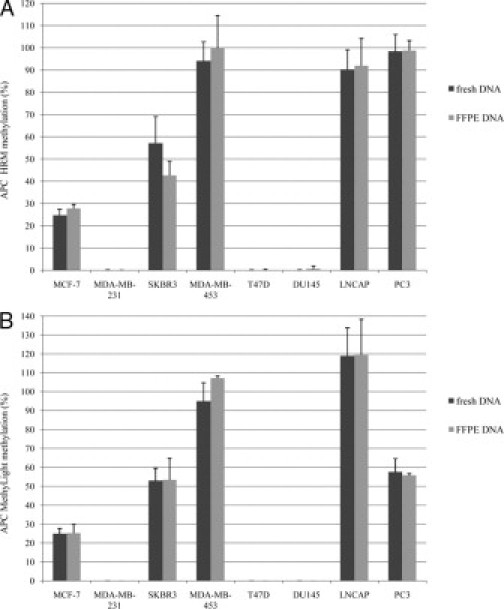
Figure 3.
Interassay variability for the APC HRM assay (A) and MethyLight assay (B) using fresh and FFPE cancer cell line DNA from eight breast and prostate cancer cell lines. The bars represent the mean of six independent experiments and the SD.
Official websites use .gov
A
.gov website belongs to an official
government organization in the United States.
Secure .gov websites use HTTPS
A lock (
) or https:// means you've safely
connected to the .gov website. Share sensitive
information only on official, secure websites.
Interassay variability for the APC HRM assay (A) and MethyLight assay (B) using fresh and FFPE cancer cell line DNA from eight breast and prostate cancer cell lines. The bars represent the mean of six independent experiments and the SD.