
Figure 4.
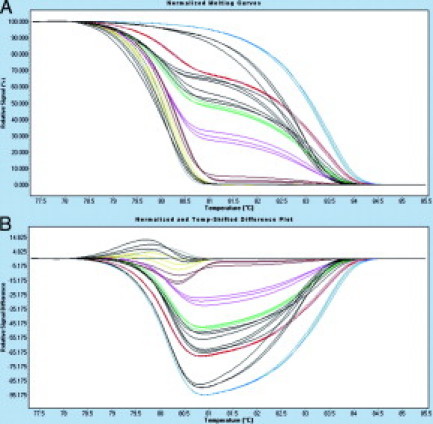
A:APC HRM curves for methylation standards containing varying amounts of methylated DNA (colored lines) and four samples (three methylated and one unmethylated) represented by black lines. B: Difference plot for the data represented in (A). Melting curves were normalized to the 0% standard. Methylation standards and samples are displayed as triplicates. Standards 100% blue lines, 50% red lines, 25% green lines, 10% pink lines, 1% yellow lines, 0.1% brown lines, and 0% orange lines.