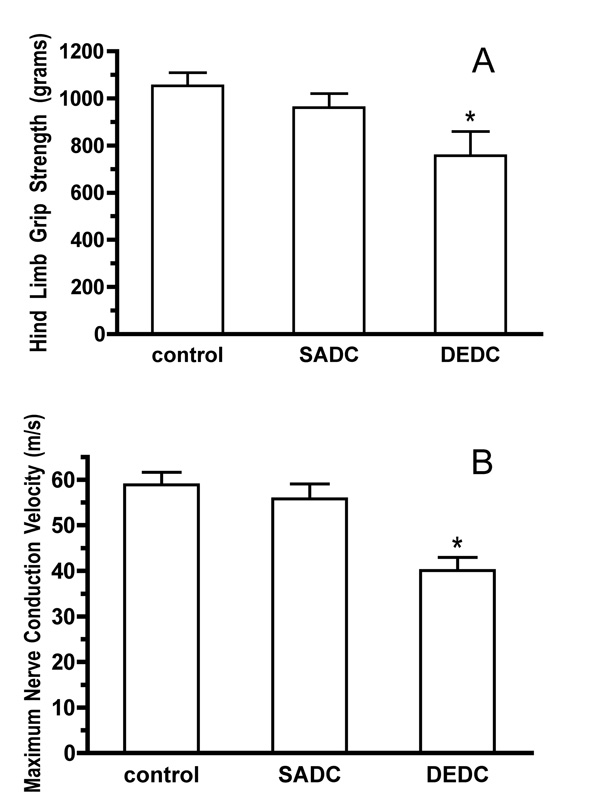
Figure 3.
Neuromuscular function as assessed by hind limb grip strength and NCV. Values for grip strength (A) are reported as mean peak compression (g). Values for NCV (B) are reported as mean velocity (m/s). Error bars represent ± SE, with sample size n=6. *p< 0.01 relative to control and SADC groups by one-way ANOVA and Tukey-Kramer post hoc test.

