
Figure 1.
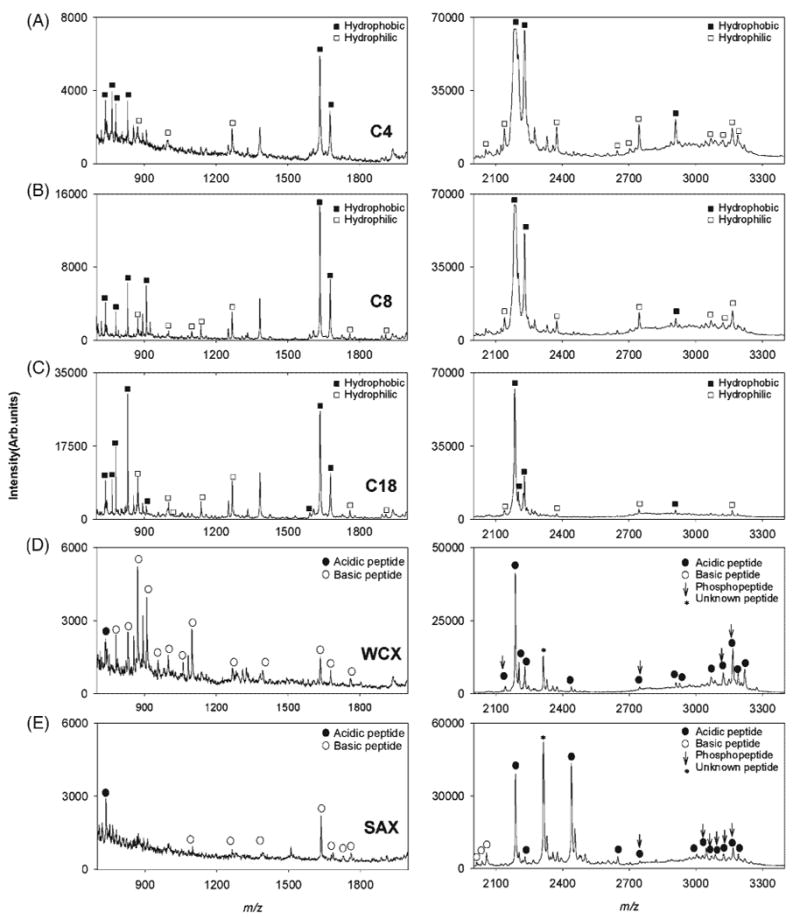
MALDI TOF mass spectra of β-casein tryptic digest treated with (A) C4, (B) C8, (C) C18, (D) WCX, and (E) SAX SPE micro tips. Left 700–2000 m/z and right 2000–3400 m/z ranges. Hydrophobic and hydrophilic peptides are denoted by filled and empty squares respectively in (A), (B) and (C). Acidic peptides (pI < 7) and basic peptides (pI > 7) are denoted by filled and empty circles respectively in (D) and (E). Phosphopeptides are marked by vertical arrows.