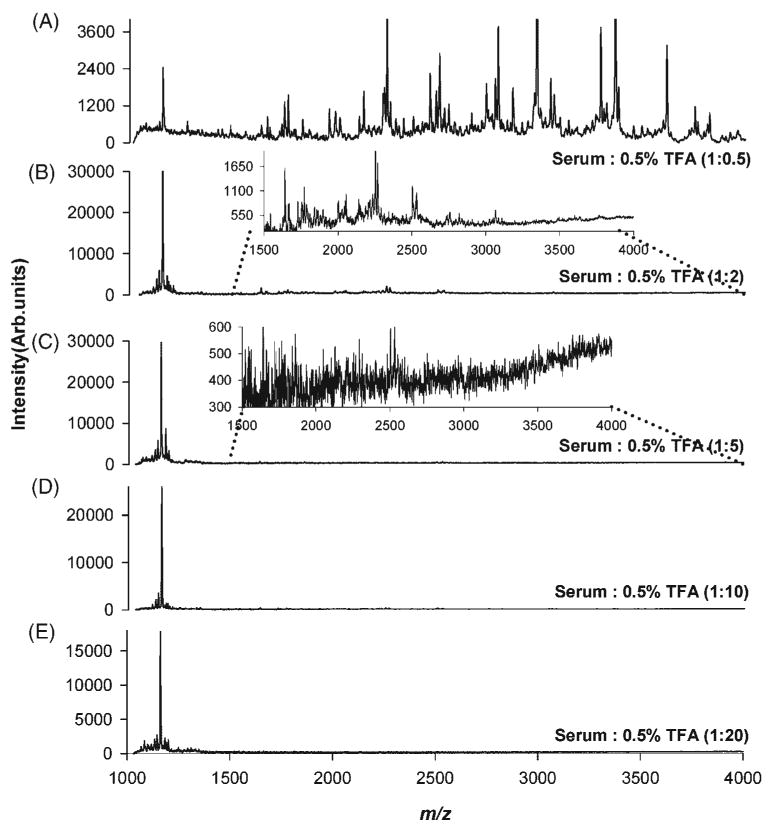
Figure 4.

MALDI mass spectrometric profiles obtained by SPE of control human serum with C18 micro tips at different dilution ratios. Healthy individual sera samples were diluted with a 0.5% TFA solution at different serum: TFA volume ratios (v/v), (A) 1:0.5, (B) 1:2, (C) 1:5, (D) 1:10, and (E) 1:20.
