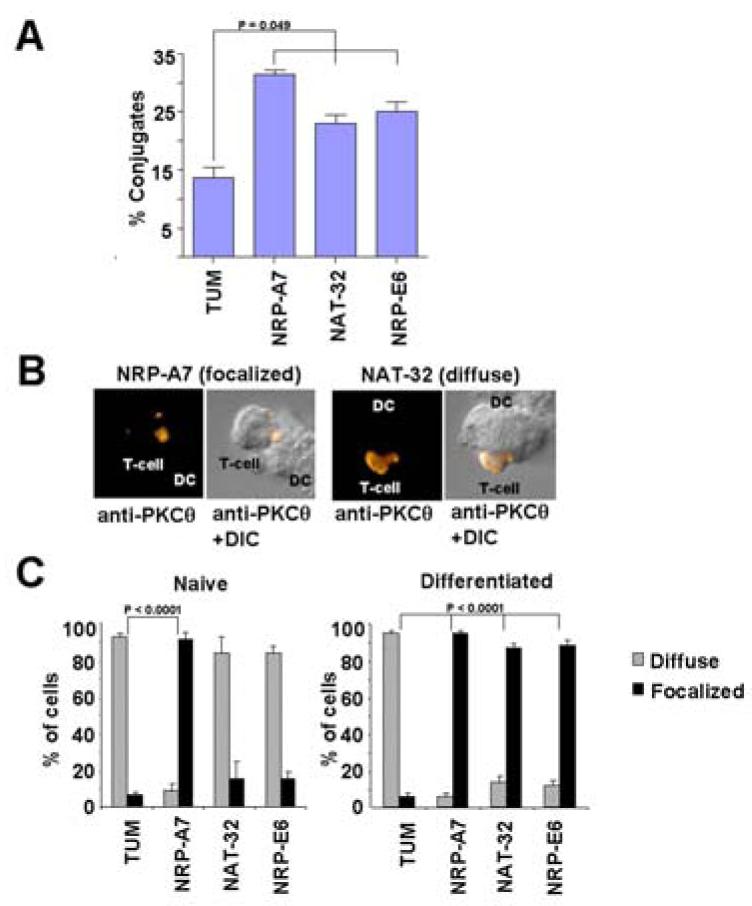
Figure 4. Recruitment of PKCθ to the synapse by strong and weak agonists.

A, % stable conjugates formed between naïve 8.3-CD8+ cells and peptide-pulsed DCs. Results are average ± s.e.m. of 3 experiments. P values were calculated by Mann-Whitney U. B and C, Recruitment of PKCθ to the contact zone in T-cell–DC conjugates formed within 30 min. B shows representative images of T-cell–DC conjugates displaying focalized (left, with NRP-A7) or diffuse (right, with NAT-32) PKCθ staining. C shows the efficiency with which strong and weak agonists induce PKCθ recruitment in naïve and differentiated T-cells. T-cell–DC conjugates were scored for presence of PKCθ in the T cell–DC contact site (focalized staining) or throughout the cytosol (diffuse staining). Results are average ± s.e.m. of ∼100 conjugates/experiment in 3 experiments. P values were calculated by Chi-Square analysis.
