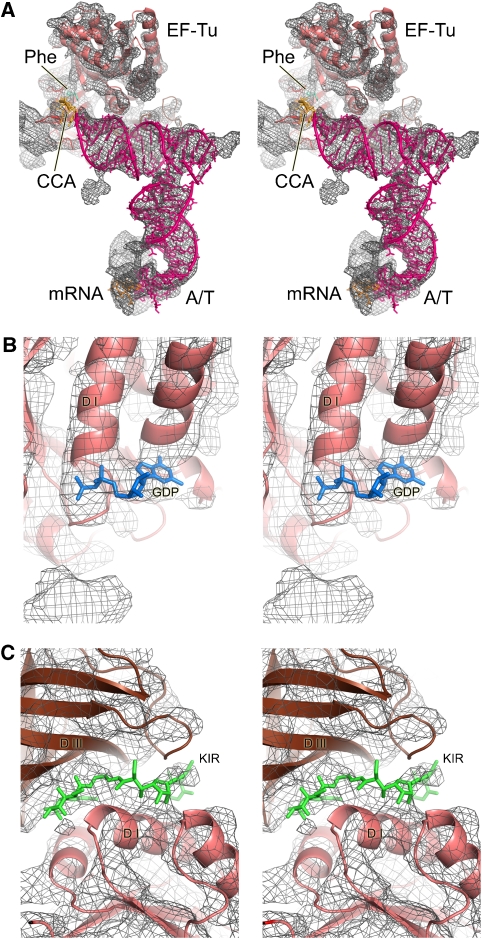
Figure 2.
Details seen in the electron density map at 5.7- to 6.4-Å resolution. (A) Overall structure of the ternary complex showing the interactions between the EF-Tu and A/T tRNA. The density for the ternary complex has been computationally separated using a mask generous enough to show the sites of interaction with the ribosome. At this resolution, secondary structure elements of RNA and protein are clearly distinguishable. (B) A region of EF-Tu showing additional density that corresponds to GDP. (C) Density for the low-molecular weight kirromycin seen between the domains of EF-Tu.

