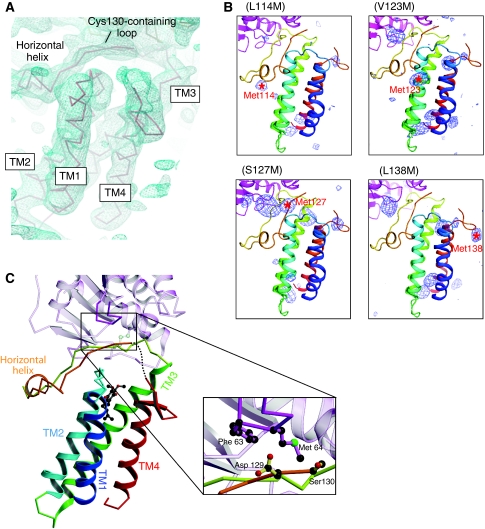
Figure 3.
Updated structure of DsbB(Cys130Ser) in disulphide-linked complex with DsbA(Cys33Ala). (A) Electron density map of the DsbB portion of the complex presented in roughly the same orientation as in (C). The Cα trace of DsbB is superposed on the electron density map drawn at the 1.0 σ contour level. Note that electron density is lacking for the Ala131–Trp135 region. (B) The Bijvoet anomalous difference-Fourier maps of new DsbB variants with a methionine substitution for Leu114, Val123, Ser127 or Leu138. The anomalous scattering peaks of selenium atoms contoured at 3.0 σ are shown in blue. The positions of selenium signals that appeared upon the indicated mutations are shown by red asterisks with residue numbers. (C) Ribbon representation of the horizontal view of the updated DsbB(Cys130Ser)–DsbA(Cys33Ala) complex structure. TM1 (residues 12–35), TM2 (residues 43–63), TM3 (residues 69–96), TM4 (residues 142–161) and horizontal helix (residues 116–120) of DsbB(Cys130Ser) are shown in blue, cyan, green, red and orange, respectively. UQ is represented by ball and stick (black, carbon atoms; red, oxygen atoms). The dotted line indicates the Ala131–Trp135 region, the electron density of which was invisible. As highlighted in the inset, the Cys130-neighbouring segment of DsbB interacts with the Phe63–Gly65 loop of DsbA (black, carbon atoms; red, oxygen atoms; green, sulphur atom). Note that Ser at position 130 is Cys in WT DsbB. For simplicity, the DsbA portion is represented semitransparently except for the Phe63–Gly65 loop.

