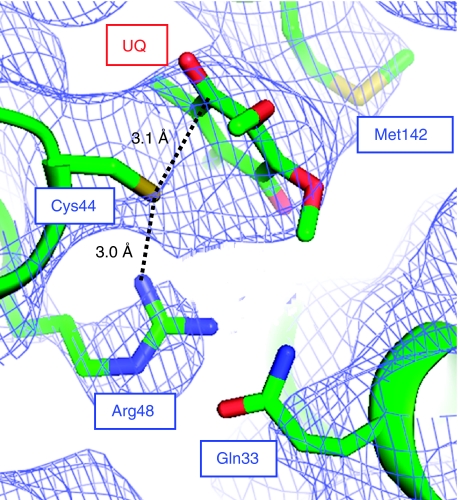
Figure 5.
Formation of Cys44–UQ CT complex on DsbB. Close-up view of the UQ-neighbouring region of DsbB(Cys41Ser), in which the electron density map is shown at the 1.0σ contour level. Note that the head group of UQ and the side chains of Cys44, Arg48 and Met142, which are shown by stick representation, fit nicely onto the electron density map. Residues 38–42 of DsbB are removed for a clear view of this region.

