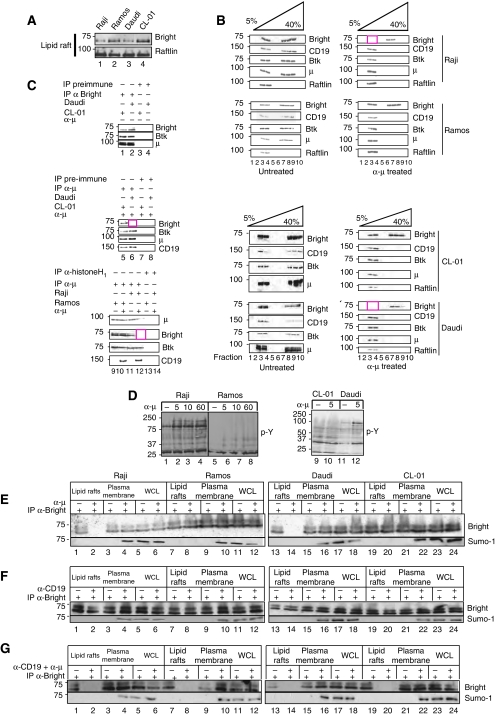
Figure 2.
Levels of Bright within lipid rafts determine BCR signalling threshold. (A) Bright levels within lipid rafts vary among B-cell lines. Lipid rafts were prepared from the indicated exponentially growing human B-cell lines (107 cells) and probed for Bright and (as loading control) Raftlin. (B, C) Antigen receptor engagement results in a discharge of Bright from lipid raft-localised BCR complexes. (B) The indicated cell lines (∼5 × 10⁸) were stimulated for 5 min with 500 ng of α-μ, followed by preparation of lipid rafts using discontinuous gradient centrifugation. Aliquots of each fraction were analysed directly by western or (C) were extracted with RIPA buffer and subjected to co-IP/western using the antibodies indicated. (D) Raji, Daudi, Ramos and CL01 cells respond differentially to BCR stimulation. The indicated cells were stimulated (100 ng α-μ for 108 cells) for 5, 10 and 60 min (Raji and Ramos; left panel) or for 5 min (CL01 and Daudi; right panel), as indicated, and whole cell extracts were blotted with α-phosphotyrosine (pY). Equal loading was confirmed by staining of the filters with India Ink (data not shown). (E–G) BCR+CD19 stimulation leads to Bright discharge from lipid rafts and accumulation of Sumo-I-Bright in plasma membranes. Raji, Ramos, CL01 and Daudi (∼108 cells) were stimulated for 5 min with (E) 100 ng α-μ, (F) 100 ng α-CD19 or (G) 100 ng α-μ+100 ng α-CD19. Lipid rafts (Raft), plasma membranes (membrane) and whole cell lysates (WCL) were analysed by IP/western using the antibodies indicated.

