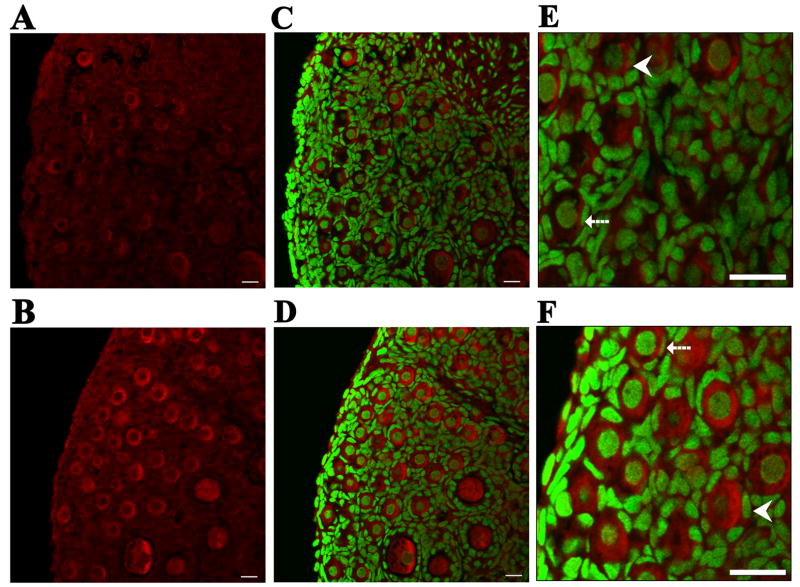
Figure 8. Effect of DMBA on visualization of mEH protein.
Ovaries from PND4 Fischer 344 rats were cultured with vehicle control (A, C, E) or 1 μM DMBA (B, D, F) for 4 days. Following incubation, ovaries were processed for confocal microscopy as described in Methods. All images were captured with a 40x objective lens. mEH was stained with Cy-5 (red stain) in (A) vehicle control and (B) DMBA-treated ovaries. Genomic DNA was stained with YOYO-1 (green stain). Combined images for staining of both DNA and mEH are shown in (C) vehicle control and (D) DMBA-treated ovaries. Magnification of (E) vehicle control and (F) DMBA-treated ovaries. Broken arrows indicate primordial follicles. Arrowheads indicate small primary follicles. Scale-bar = 25μM.

